HOME Page
The "Clinician" menu is where the Eligible Clinicians reports (EC) are housed; Hospital Measures are under the "Hospital" menu.
Value Sets are found in the Value Sets menu. The current Encor version can be found in the lower left hand corner and the last load date is in the upper right corner.
To see other applications (Encor D, or Encor A), click on the ![]() :
:

Click on the MIPS Score tab to view the MIPS Scoring Summary. From this view, the scoring for each category is displayed and an overall preliminary total is available.

To view the measure details for each category; click on the > and the 6 best performing measures display. A required outcome measure is always listed first followed by the next 5 best performing measures. Bonus points are included to provide the full scoring from CMS rules. Click the other > to see the details for the other categories.

The eCQM EC tab gives you a visual display of the rates and the numerator. The grid line shows how many patients are in the numerator, and ONLY those patients who are in the DENOMINATOR ONLY (not the true denominator). This is a quick view of the results from that perspective.
For more details, click on the View MIPS Quality Measures Report to view the true numerators, denominators and measure details. This grid does not detail inverse measures so keep that in mind as well.

The IA measures page will display selected measures for the report year.

The PI EC measures page works the same way as the eCQM page. The grid is a visual of the numerator patients and the IN DENOMINATOR ONLY patients. It is not the true denominator. (Any attestation measures will display as below since there is no patient data for these measure types. To see the details for the measures, click on the View MIPS PI report.

Clinician TAB
Under the Clinicians tab, you will find additional menu items for: Reporting, Administration, Configuration and Import/Export Functions.

Reporting:
Clicking on the Clinician Scoring Summary brings you to the MIPS scoring page. See the MIPS summary report in the HOME section above for details.


Patient Look-up takes you to the Patient search for all measure results and information for a specific patient.

Use the search function to find a patient by name or Medisolv ID number.

The eCQM's option displays the current eCQM’s.

The page works the same way; click on the + sign to see patient details, the Icon for the specifications, the clinicians tab to see individual clinician rates or the population tab to see the entire population, not just the selected providers.

The PI measures:

These can be viewed in the same way using the + sign for patient details, the specifications using the Icon and the Clinician tab for viewing individual provider results.

The IA measures:

Measures display and may be updated from this page:

PI Cohorts:

Used to capture data for a discreet set of patients; same functionality as previously described. Select the group and all of the SOP’s and click on Query to get the patient list and results. Functionality to download to Excel or create a QRDA1 file to submit a distinct patient population.


Non Billing Provider Reports – for sites that have providers who do not bill. These menu items allow you to view their results for the PI measures and eCQM’s

An example of non billing Providers would be NP’s and PA’s who see patients but bill under the NPI of the attending/co-signing physician.
Clinician Patient Results and Providers:

This report allows you to search for patients for individual providers as well as see patients and results. Clicking on the patient name leads you to the patient details for that measure. By entering a provider name, you can filter by provider for results. As with other screens, you can also drag and drop any column into the gray area labeled “Drag a column header here to group by that column,” to group by any label shown.

Validation & Improvement Dashboard: is the key to identifying data gaps.

There are two sides; Supplemental Data Elements (Ethnicity, Gender, Source of Payment and Race) on the left and Value Set Quality Check (Value Set Completeness) on the right. You can click on either side to get more details. Green indicates there are few gaps in the data. Yellow indicates there is up to a 15% gap and may require attention. Red indicates a greater than 15% gap in data and requires review.

Supplemental Data Elements: This page will displays the supplemental data elements collected, the number of codes in the value set for each data element, codes currently in use and patients with missing or invalid codes in the current data set. You can use this information to identify gaps in the supplemental data. For example, the site below has very few gaps in Race or Payer, but may need to focus on the collection of Ethnicity.


Value Set Quality Check: Checks the codes included in each value set for all active eCQMs, compares codes to those associated (i.e. mapped) with your patient encounters and provides additional details on which value sets/codes are present or not found.
The OID will display with the number of codes in the value set and the number of patients with that code. This will help in improving data capture related to coding issues and mapping. If a value set has no data, codes may be missing in the data from the EHR for that OID which could lead to no results or inaccurate results for a measure(s).

Patient Code Search: Allows the option of searching codes

Using this report, you can see which patients have a code or a value set mapped to their results. Another tool to use to check on mapping.

Administration TAB
Some of the functions in this section are for Medisolv Administrators only. This document will only review those items used by Medisolv Users.
Users may create snapshots to have a record of the data submitted for each reporting year.

Click on Create Snapshot and this window will open:

Complete the fields for your submission using the dropdown fields to make your selections. For MIPS, it is recommended to use the entire reporting year as when you complete a submission you may need to select a time frame for each measure group. Using this saves space as snapshots are big files to store. All the same functionality as exists in the application exists in the snapshot so you can look at specific time periods if needed in the snapshot. Snapshots may take several minutes to create. Please be patient. You will get a message when the snapshot is completed. To view the snapshot and ensure that the data is there, click on the View Snapshot Hyperlink and the snapshot will open.

Once that is enabled, use the same functionality as in the product to view the data in the snapshot; in this example, the eCQM’s were selected.
The page will open to the measures that are selected; all the same page functionality exists within the snapshot. While in the snapshot the green header will remain on the screen. To exit the snapshot; click on the link to End Snapshot view and the page will return to the data page in the application and the green header will no longer display.


Snapshot listing:
To view the snapshot click on the Snapshot Listing button

To select a snapshot to view; make sure you select either EH or EC depending on the type of snapshot and click on the green check mark. Select the reporting year to select the correct snapshot as well. That will open the snapshot as above. To edit the name of the snapshot ONLY, click on the pencil and rename the snapshot. The Red X will delete the snapshot. Please do not delete snapshots that were used for a submission of any kind. To hide the names of deleted snapshots, click he Hide Deleted Snapshots and they will not display on the page.

User Administration Access:
Prior to setting up new users in Encor E, they must first be added to the AD (active directory) group that Medisolv uses. This is usually completed by a Network Admin at your organization. Once they have been added, you will be able to grant them access by going to your Encor E application, to access go to the Administration Tab and User Administration Access.

Select the user from the dropdown list.

Complete the fields as displayed; if you do not check the Patient detail Access box, the user will NOT see patient details in the application. Save the access.

Then go to the User Group Access page.

From the list of users, select the new user, check the needed access and click the save icon.

A message displays when the access is saved.

Audit Trail: Displays user and actions taken in the application for the last 30 days.

Change the date range as needed to view actions further back.

Configuration Tab
The majority of options under this tab are for program administration by Medisolv.
There are a few options for end users however. In order to see what has been configured in specific data elements for each measure. click on eCQM Configuration View.

The configuration report displays, from left to right, the data element name, the associated OID, the associated attributes, configuration mnemonics from your dictionaries and the measures using that data element.

This report can be downloaded into Excel, Word or a PFD file by clicking on the gear in the upper right had corner and selecting export. Pick the type of file and save and print as needed. If additional configuration is needed, please reach out to your Quality Advisor.

Import/Export Functions:
If you need to import or export QRDA files use this section.
Importing of these QRDA files is primarily completed by the Medisolv staff.
Exporting QRDA1 or QRDA3 files for cohorts can be done from this screen once you have completed the cohort upload. These can be sent to the ACO or others who may request this data for other reporting entities.

Patient Cohort Uploads: This is used for ACO’s (or other entities) looking for a discreet list of patient data.

Create a list of Medical Record numbers in a CSV file for upload as a cohort group. Name according to your needs.
Click on the New Group button in the lower left hand corner and the Population Name window opens. Name the group according to your needs/timeframes and save when completed.
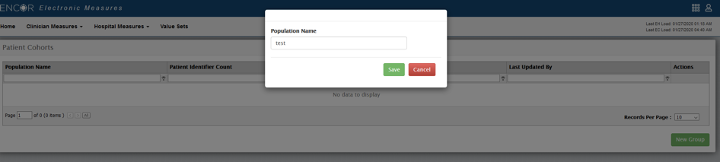
This window will display; Click on the Upload Icon in order to upload your file
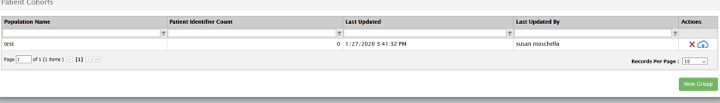
Once this is done, the file will display with the name, number of patients in the measure, the date uploaded and the user who created it. Then you can go to the Cohorts reporting to see the data for those patients (in the reporting section of this document).
Health Information Exchange PI Upload:
To load HIE or HISP data in Encor-e that will allow for the import of a CSV file (provided by the HIE/HISP) containing data related to successful summary of care transmissions. After importing the data to Encor-e, both the Numerator and Rate Result for the HIE objective measure will display in the application. The functionality is the same on the hospital and Clinician parts of the application.

Before getting started it is very important that you review the following requirements-
- Per the measure specification, the referring provider must have reasonable certainty of receipt by the receiving provider to count the action toward the measure. Please confirm that the data being imported meets this criteria. It’s the hospital’s responsibility to review the file for accuracy and remove failed transmissions before importing. The import tool calculates the Numerator only, failed transmissions should NOT be included in the file.
- The imported file must be a continuous data file containing all data for the reporting period. You can import as often as you’d like but the file will overwrite previously imported data; you will need to import year-to-date data every time you import.
- If you import erroneous data, you can either import an empty file to overwrite or simply re-import the corrected year-to-date data.
- The file must be in CSV format and include 2 columns, with headers, labeled EXACTLY as shown in the screen shot below:

Remove all extraneous details and use the date format shown above. Additional data, fields, columns, etc., will cause an error on import.
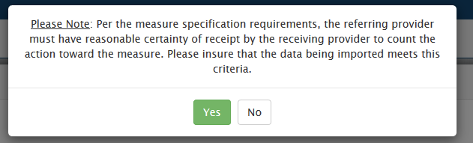
Click on Browse and select your file; enter in the measurement year then Click on the Import File button to load the data:

This message will display; click yes if this is correct and the file will upload.
The nightly refresh must run to update the data in the measure
This is an overview of the application and the new user interface. Please talk to your consultant if there are other questions about any of the information contained in this document or the application. Thank you.