Save View Layout/Remove Saved View Layout
Drag and Drop
The drag and drop feature can be used to move a field from one place to another.
- To drag and drop:
- Left click on the field you want to move and hold
- Drag the field to where you want it
- Drop it when you see two white arrows
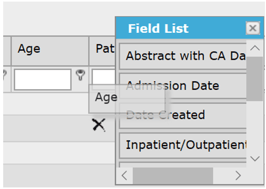
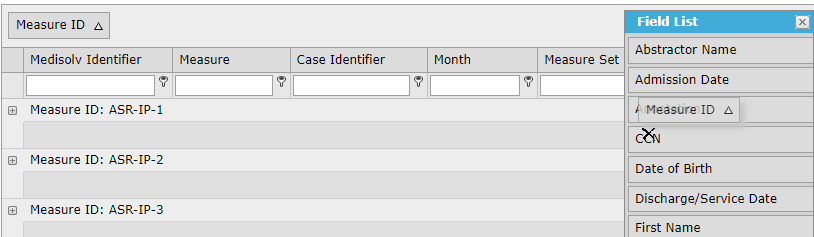
- If a field is dragged and dropped to the Field List, it is removed from the Abstraction List or Report. When this functionality is used, a black X is displayed when the field is dragged to the Field List to indicate this removal.
- Move a field in the Field List to the Abstraction List or Report – either to group or to add a column to the report.

- Move a field from the Abstraction List to the Field List or the Grouping Bar

- Move a field in the Grouping Bar to the Abstraction grid to create a column or to remove it and return it to the Field List.


Expand/Collapse
On some pages, data grids and lists may be displayed with a blue header with an up/down arrow. You may also see an Expand/Collapse icon that allows you to open all the grouped data for inspection or hide them from view. These act as toggle expand/collapse buttons. Clicking once expands/collapses the section under it. Clicking again reverses the operation.
- Blue Header with Up/Down Arrow
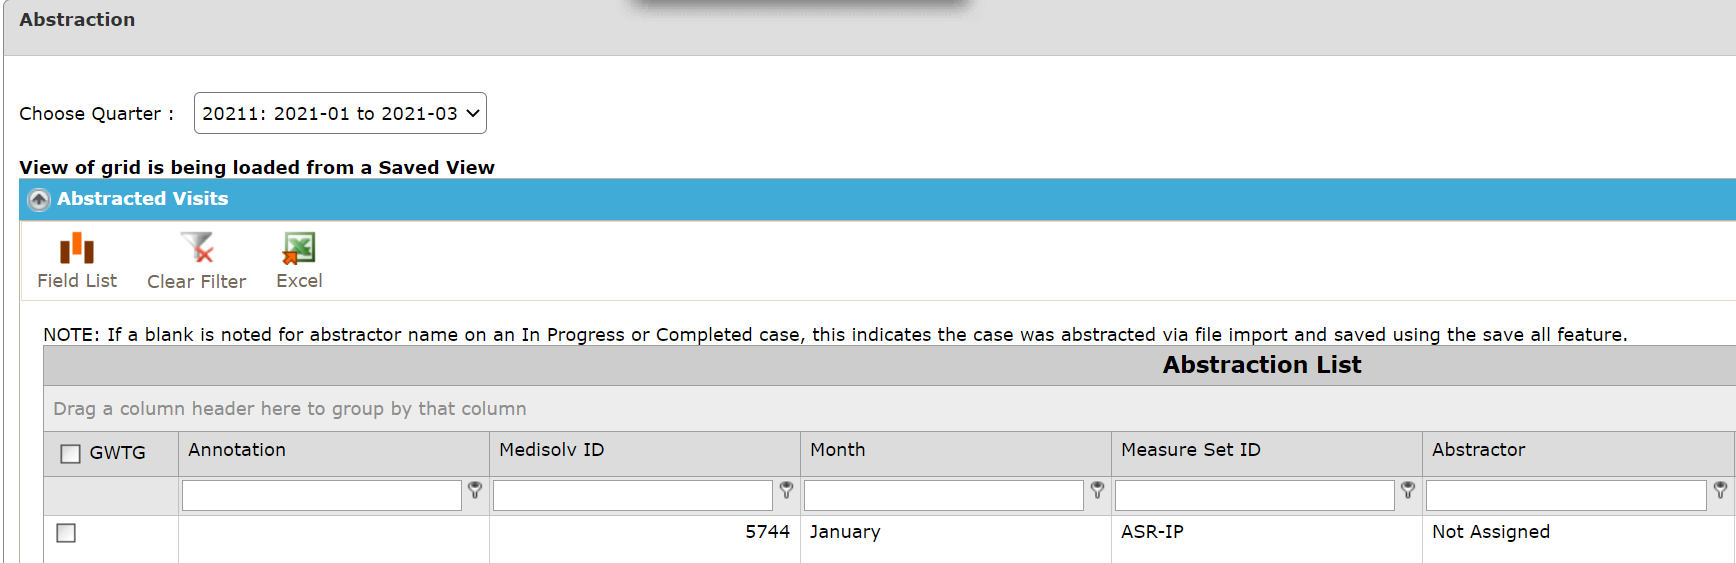
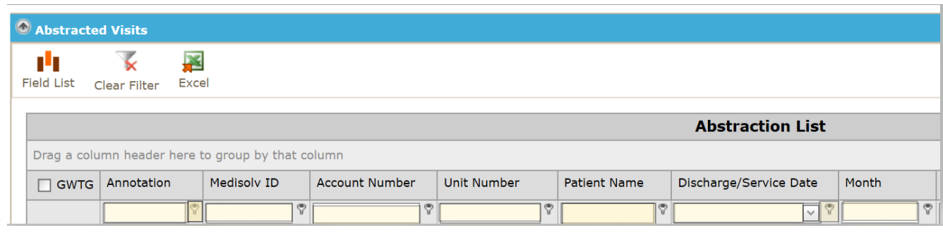
- On the Abstraction List, the arrow next to Abstracted Visits has the Abstraction list expanded.
-
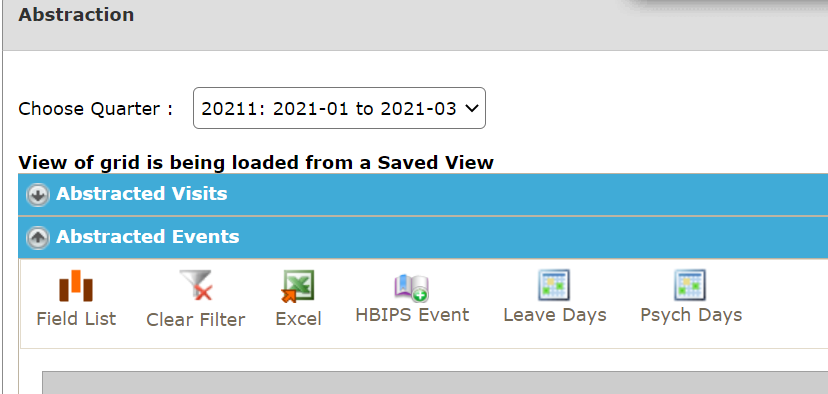
- Clicking the arrow collapses the Abstracted Visits grid.
- Expand/Collapse Icon
- The Expand/Collapse icon is available on the abstraction list and most results grids.
- Expand/Collapse will expand every (+) on a report, all the way down to patient level data.

Before:
After:
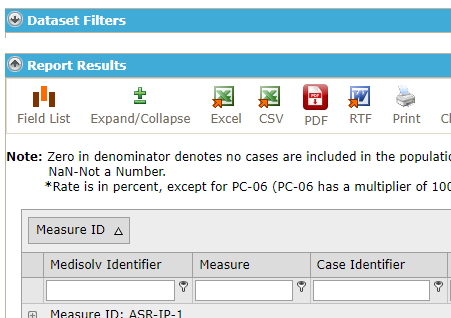
Export to Excel or CSV
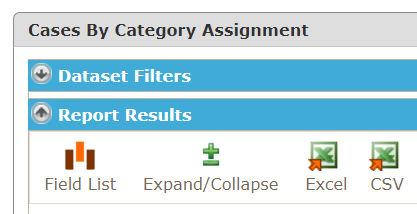
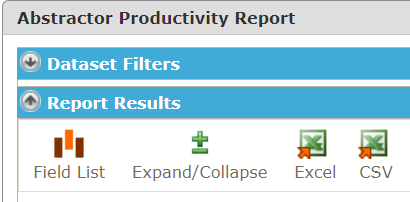
The option to export data to Excel or CSV is available on several pages in ENCOR Abstracted. Some examples are pictured below.
The differences are:
- Export to Excel can be used on grouped data, Export to CSV cannot
- Export to CSV can be used for large datasets - 1.2 million cells maximum (# of rows x # of columns)

To export:
- Run the report
- Expand what you want to see in the export document
- For Excel - Click the Excel icon
- Select Open, Save or Cancel. This may appear different depending upon your browser.

- For CSV - Click the CSV icon
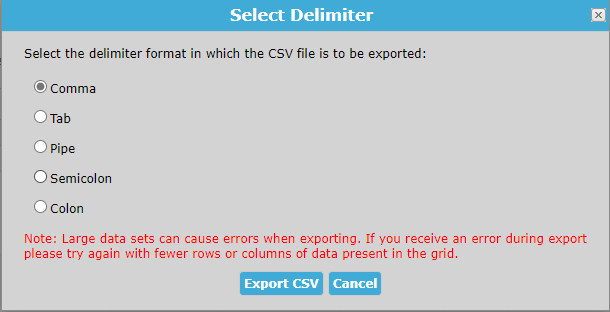
- CSV has several delimiter options: Comma, Tab, Pipe, Semicolon and Colon - select the delimiter you wish to have in the export file
- Select Export CSV
- Select Open, Save or Cancel. This may appear different depending upon your browser.
Exporting Report Data
There are four options for exporting report data.
- Export to Excel
- Export to CSV
- Export to PDF
- Export to RTF (Rich Text Format – a Word format).
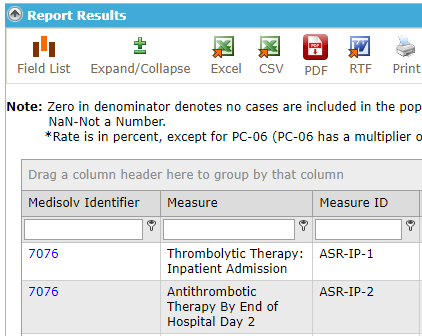
The icons below will display for any report that has these options.
Exporting
To export – run the report, expand what you want to see in the export document and click the icon for the format required.
Export to Excel

- Select Open, Save or Cancel.

Export to CSV

Groupings cannot be used when exporting to CSV. This option should be used for large exports (max 1.2 million cells, # of columns x # of rows).
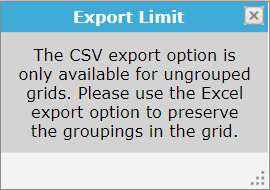
Several delimiters are available for the exported file - Comma, Tab, Pipe, Semicolon and Colon.

Note: Large data sets can cause errors when exporting. If you receive an error during export please try again with fewer rows or columns of data present in the grid.
The CSV will appear under downloads.

Export to PDF


- Click Export PDF.

- Select Open, Save or Cancel

Export to RTF


- Click Export RTF

- Select Open, Save or Cancel

Field List
The Field List is a list of additional fields you can drag and drop into any results grid. The Field List for each report results grid is unique to that report. The abstraction list has a field list available to add any desired fields to the grid. Clicking the Field List icon will display the fields available for that results grid.
Fields that are not wanted in the report can be removed by opening the field list and dragging/dropping them into the field list.
- Click the Field List icon.

- This opens the Field List selection.

- Left click and HOLD the field you wish to move into the results grid.

- Drag the field to where you wish to place it in the report. Note the white arrows - this is where the field will be placed to create a new column in the report.
- Release the left click and the new field is now the header of a column on the results grid.
- To remove a field from the results grid, left click and HOLD the field you wish to remove.
- Drag the field to the field list. Once the black X appears, release the left click.

- The field is now back in the field list and removed from the results grid.

Filter and Remove Filter
Filtering is available on pages with a results grid, such as the abstraction list and report results.
- The empty box at the top of each column is a filter.
- The filter criteria icon is next to each filter.
![]()
- For date fields, the filtering criteria are listed below.

- For non-date fields, the filtering criteria are listed below.

Filtering
- Select your criteria.

- Type a few characters of the data that is to be filtered.

- Your results are displayed

- For date filtering, select your criteria

- Either select a date from the calendar

- Or type a date into the filter

- Your results are displayed

- To clear all filters, click the Clear Filter icon

Grouping
Grouping is available on pages with a results grid, such as the abstraction list and report results.
Grouping can be accomplished by using the drag and drop feature.
- Drag and Drop
- Left click a field, hold the left click and drag the field to where you want it.
- Drop – release the left click.
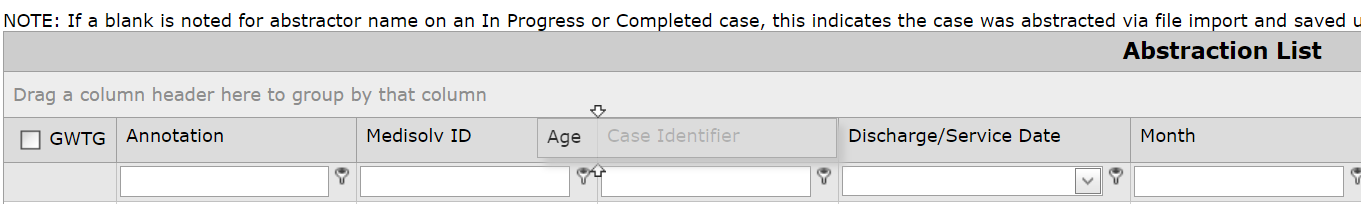
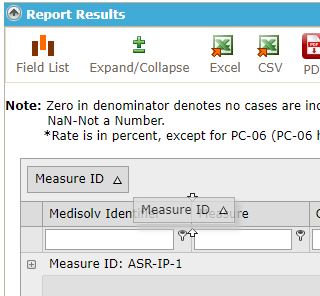
- Group by left clicking on the group by field and holding the left click.
- Drag the field to the top of the grid and release the left click.

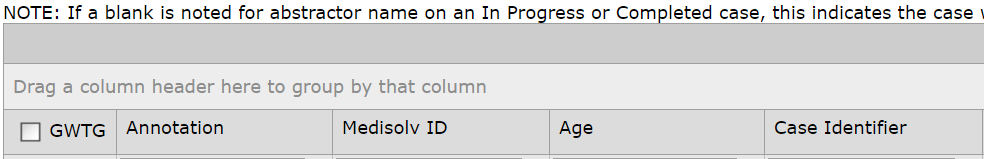
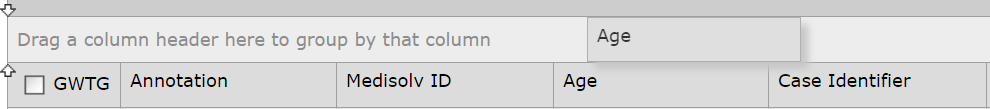
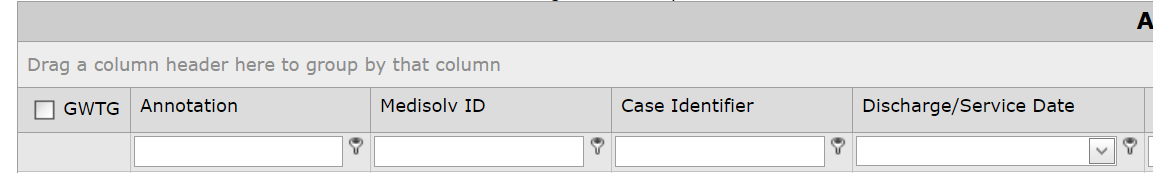
- Left click column header, hold, drag to “Drag a column header here to group by that column” (see above)

- When the two white arrows appear (as shown below), release the left click.

- Grouping done.

To remove a grouping:
- Drag and Drop the Grouped field to the grid - to make a new column

- Left click the grouped field, hold the left click and drag the field to where you want it.
- When the white arrows appear, drop – release the left click to form a new column.
- Drag and Drop the Grouped field to the field list to remove it from the report
- Open the field list

- Drag the grouped field to the field list.
- Drop when you see the black x
Hovering
Hovering over abbreviations or ID fields displays additional details associated with the record.

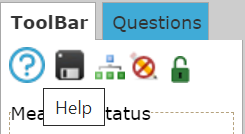
Hovering over the Measure Status box on the Floating Toolbar displays the Measure Name.

Hovering over the icons on the Floating Toolbar displays the action of that icon or what the icon will display if selected.
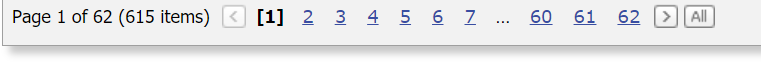
Pagination
In all grids, page navigation is provided for ease of use.
Standard page navigation options such as Previous and Next icons are present at the bottom of the grid.
When there are 1000 items or fewer, an All link is displayed. The All link is not displayed for grids that contain over 1000 items.
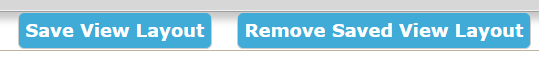
Save View Layout
The Abstraction List, as well as several reports, can be arranged to a preferred view using instructions from Drag and Drop, Grouping, Sorting, Filter and Remove Filter, Hovering and Field List.
- Once the page is set up in the desired format, click Save View Layout. This will be the default layout the page opens in.
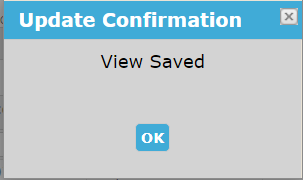
- The below pop-up appears after a view is saved.
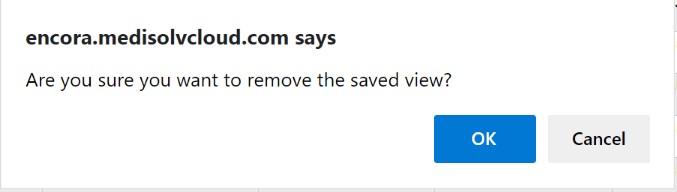
- To remove a saved layout, click Remove Saved Layout. The below pop-up is displayed. Click OK to remove the saved view.
Sorting
Sorting is available on pages with a results grid, such as the abstraction list and report results.
- To sort, click on the column to sort in ascending order.

- Click a second time to change the sort to descending order.

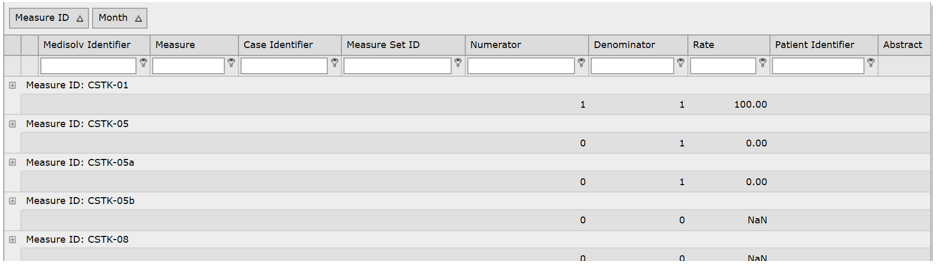
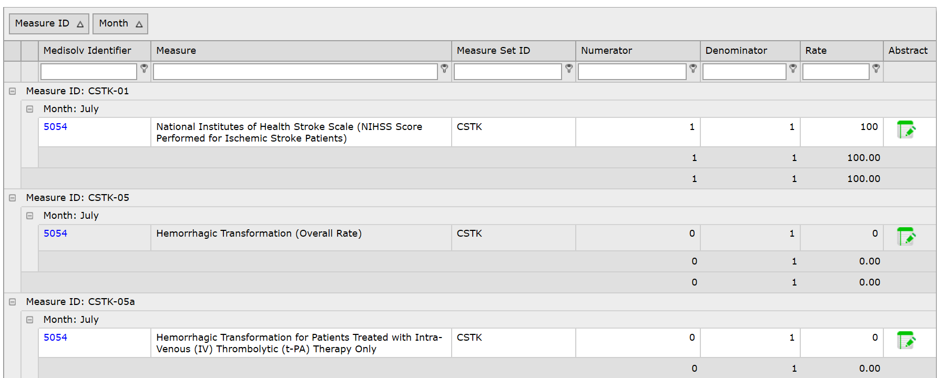
- Hold shift and click a second column to sort by two fields, as shown below sorting Month descending and Measure Set ID ascending.

- To remove the sort, hold the CTRL key and select the field that is currently sorted.