A standard GL Dashboard page includes the following details:
- Indicator Name,
- Trend - which displays how the indicator has been trending till date,
- Calendar/Fiscal Year* (for previous year) - the indicator value for the previous year,
- Calendar/Fiscal Year* (for current year) - the indicator value for the current year, and
- Monthly/Quarterly/Annual indicator values for the current period with their associated scores*.
*Scorecard and calendar/fiscal time periods depend on how the dashboard has been set up.
Hovering over the Trend icon for an indicator displays additional details, such as how the indicator trended, whether an upward or downward trend is considered better for the indicator, and what the slope is.
Hovering over the annual, quarterly, or monthly values for an indicator displays details about the indicator such as indicator rate, numerator, denominator, goals and benchmarks.

GL Dashboard: Gear Menu
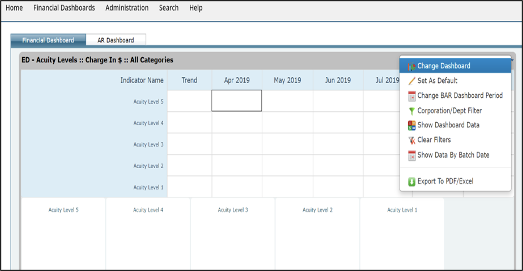
If you hover over the Gear icon on the top right corner of the GL Dashboard grid, you will see additional options displayed as a dropdown menu.
GL Dashboard: Settings Menu
GL Dashboard Gear Menu: Monthly Scorecard
Click the Monthly Scorecard option to view the indicator values and scores by month. Values for the current month and the previous 11 months are displayed.
GL Dashboard Gear Menu: Quarterly Scorecard
Click the Quarterly Scorecard option to view the indicator values and scores by quarter. Values for the current quarter and the previous 8 quarters are displayed.
GL Dashboard Gear Menu: Annual Scorecard
Click the Annual Scorecard option to view the indicator values and scores by year. Values for the current year and the previous two years are displayed.
GL Dashboard Gear Menu: Change Dashboard
If you would like to view a different dashboard, you can do so by changing the dashboard. Click on the Change Dashboard link to bring up a grid of available dashboards. Select a dashboard from the grid. This action displays the dashboard you selected. Any filtering applied on the previous dashboard is removed.
GL Dashboard Gear Menu: Set as Default/Reset to Default
To set the dashboard you are viewing as your default dashboard, click on the Set as Default. This dashboard will be displayed by default the next time you open the Dashboard page. The Set as Default option in the gear menu is changed to Reset to Default.
If you would like to revert to having no dashboard as default, you can click on Reset to Default option. This removes the default dashboard for your login id. The next time you open the Dashboard page, the dashboard you use most frequently will be displayed. When you select this option, the Reset to Default option toggles back to Reset to Default.
GL Dashboard Gear Menu: Set Budget as Goal/Set Performance Data as Goal
By default, indicator scores are assigned based on the performance data set up for it. However, you can toggle between using performance data and budget for score calculations.
To override the performance data set for an indicator and instead use the budget for score calculations, click on Set Budget as Goal.
The monthly budgets for the indicator are used for recalculating the scores, and the dashboard is redisplayed with the new scores. In the Gear menu, the Set Budget as Goal option is replaced with Set Performance Data as Goal option.
To revert to using the performance data for score calculation, click on Set Performance Data as Goal option.
GL Dashboard Gear Menu: Corporation/Department Filter
Dashboard data can be filtered by corporation or department. Click on the Corporation/Department Filter to view the list of available corporations and departments. Only those corporations and departments you have access to will be listed. Select the corporations and the departments to filter by and click Ok.
The dashboard display changes to data for the selected departments only. Additionally, a Filter icon next to the dashboard name on the Dashboard page to indicate that the dashboard data is filtered.
To remove filtering, click Clear Filters from the gear menu.
GL Dashboard Gear Menu: Category Filter
If you would like to view the results of a specific category and subcategory, you can do so by using the Category Filter link. This action displays a grid of available categories. Select a category from the grid. Any subcategories set up for it are presented to you. When you select a subcategory, the dashboards are filtered and redisplayed in the dashboard grid.
GL Dashboard Gear Menu: Show/Hide Empty Indicators
On a dashboard, indicators without data are displayed as empty lines. To declutter your view, you may want to hide the empty indicators. To do so, select Hide Empty Indicators from the Gear menu. Once the empty indicators are hidden from view, the menu option toggles to Show Empty Indicators.
GL Dashboard Gear Menu: Clear Filters
Click the Clear Filters option to remove any filters that have currently been applied to the dashboard list. The Filter icon next to the dashboard name in the header is hidden as well.
GL Dashboard Gear Menu: Export to PDF/Excel
You can export dashboard data to PDF or Excel. You also can email the dashboard data as a PDF or Excel attachment.
Click the Export to PDF/Excel option. RAPID displays the Export/Mail to PDF/Excel pop-up. Choose what you would like to do by selecting the Export or Mail radio button.
The Export option allow you to enter notes. You can click on the PDF or Excel icon to export the file to the specific format.
The Mail option allows you to select one or more users to send the report to. You can specify a Subject, Message, and select the file format (PDF/Excel) for the dashboard data to be emailed. You can also check the Send a copy to me to have a copy of the email cc'd to you.
GL Dashboard: Financial Indicators Report
Clicking on an indicator name in the GL Dashboard Page displays the Financial Indicators Report page.
The Financial Indicators Report Page is divided into the following sections:
- Results section, in which tabular data is displayed for monthly, quarterly and annual time periods,
- Charts section, where the general trend for the indicator is displayed in graph format for monthly, quarterly and annual time periods.

Financial Indicators Report: Filtering Options
There is one major filtering option provided for the Indicator Report page i.e. the Time Span filter.
The Time Span slider control allows you to filter your report based on time. You can drag and drop to set your From and To dates for filtering the report by.
The earliest begin date available for the time slider control is set based on when RAPID data was first imported. The latest end date available for the slider is the current month, quarter, or year.
Once you have set your time period, the report is automatically refreshed with data pertaining to the dates you selected.

Financial Indicators Report: Gear Menu
If you hover over the Gear icon on the top right corner of the Financial Indicators Detail grid, you will see additional options displayed as a dropdown menu.
Financial Indicators Report: Gear Menu

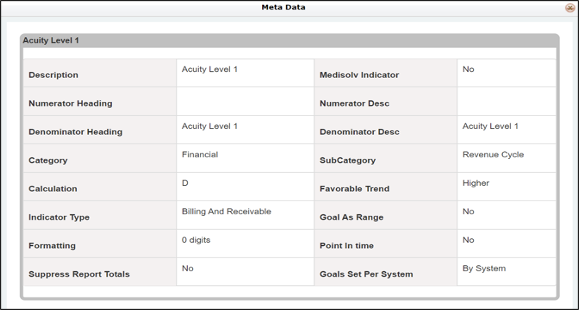
Financial Indicators Report Gear Menu: Meta Data
The Meta Data link opens a popup, which lists the metadata associated with the indicator. The page displays the following details:
- Description of what the indicator measures,
- Medisolv Indicator - Yes in this field means that this is an indicator created by Medisolv; No means that this is a custom indicator,
- Numerator Heading,
- Numerator Desc,
- Denominator Heading,
- Denominator Desc,
- Category,
- Sub Category,
- Calculation,
- Favorable Trend - displays Higher, Lower, or Unknown,
- Indicator Type,
- Goal as Range - displays a Yes if the goal is a range of acceptable values; displays No if the goal is single number the hospital would like to achieve,
- Formatting - displays the number of digits after the decimal point that are used for rounding in N/D calculations,
- Goals Set per System - displays By System if indicator goals are set system-wide for the hospital system; By Hospital if indicator goals are set by hospital.
- Rate Heading - (for GL Indicators only) displays Rate heading set for the indicator.
Financial Indicators Report Gear Menu: Annotations
If you wish to view/enter annotations for any time period, click the Annotations option from the Gear menu. Any existing annotations for the selected Indicator Report time period are displayed.
Annotations: Adding an annotation
To create a new Annotation, click on the Add (Pencil) icon at the bottom of the section. This action displays the Add/Edit popup.
Select a For Date date from the Date Selector. Enter any notes you may have in the Annotation Entry text area.
Once you are done with entering details:
- Click the Save icon to save your annotation entry, or
- Click the Cancel icon to discard your changes


If a new annotation is added, a yellow information alert is displayed next to the Gear icon on the Indicator report bar. By default, this alert is set to display for 7 days. If you'd like this changed, please talk to your Medisolv Client Services representative.
Annotations: New annotation indicator

Annotations: Editing an annotation
To modify an existing Annotation entry, click on the Edit (Pencil) icon next to it. This action results in Edit and Delete icons becoming visible in the Annotations grid, next to each individual record.
Click on the Edit icon for the annotation you'd like to modify. This action results in For Date and
Annotation Entry textboxes being displayed in edit mode.
Modify the For Date and/or the Annotation Entry text area. Then click the:
- Save icon to save your annotation entry, or
- Cancel icon to discard your changes

Annotations: Deleting an Annotation
To delete an existing Annotation entry, click on the Delete (X) icon next to it.
This action results in RAPID displaying a message "Are you sure you want to delete this record?" Click the:
- Yes button to delete your annotation entry, or
- No button to leave it as-is.

Financial Indicators Report Gear Menu: Export/Email to PDF/Excel
You can also export or email the data you see in the page by clicking on the Export/Email to PDF/ Excel option from the Gear menu. You can select from PDF, Excel or Word formats from the popup that shows up.
Financial Indicators Report Gear Menu: Export to PDF/Excel/RTF
The Export options are displayed when you select the Export radio button on the Export/Email to PDF/Excel popup. The display for this option includes:
- Grid Type - select one or more grid types from Monthly, Quarterly or Annual options,
- Annotations - check to include annotations in your email or export; leave unchecked to exclude annotations,
- Metadata - check to include metadata in your email or export; leave unchecked to exclude metadata,
- File Name - enter the filename the data is to be saved
Once you are done with entering details, click on PDF, Excel, or Word icons to export and save the file to that format.

Financial Indicators Report Gear Menu: Email to PDF/Excel/RTF
The email options are displayed when you select the Mail radio button on the Export/Email to PDF/ Excel popup. The display for this option include:
- Grid Type - select one or more grid types from Monthly, Quarterly or Annual options,
- Annotations - check to include annotations in your email or export; leave unchecked to exclude annotations,
- Metadata - check to include metadata in your email or export; leave unchecked to exclude metadata,
- File Name - enter the filename the data is to be saved as,
- To - select one or more recipients to receive the report,
- Subject - enter a subject line for the message,
- Message - enter the body of the message,
- Attachment Type - select one or more types from PDF, Excel or RTF, and
- Send a copy to me - check to have a copy sent to yourself; leave unchecked otherwise.
Once you are done with entering details, click on the Email icon to have the report emailed in the specified format.

Financial Indicators Report Gear Menu: Back to Dashboard
The Back to Dashboard option takes you to the Dashboard page. If you arrived at the Indicator Report page from the Dashboard page, the dashboard you were viewing report before selecting the indicator is displayed. If you arrived at the Indicator Report page from the Indicator List in the Administration section, the default dashboard you have set up for yourself is displayed.
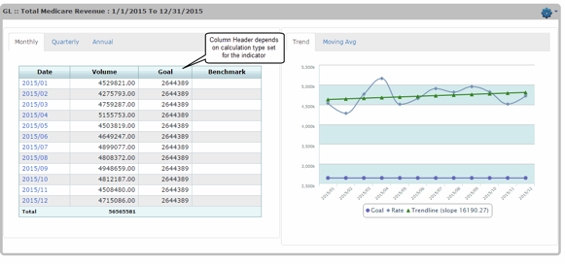
Financial Indicators Report: Results Section
The data in the Results Section of Financial Indicators Report can be viewed by different time periods. The available views include Monthly, Quarterly and Annual Views.
By default, the Financial Indicators Report is displayed in the Monthly view. The header of the grid displays a bread crumb trail, which shows the dashboard name (if you arrived at this page from the Dashboard page), and the indicator name.
The columns displayed in this section depend on the metadata set up for the indicator.
Financial Indicators Report: Monthly View
To switch to a different view, click on the Quarterly or Annual tab. This action redisplays the Financial Indicators Report with the selected view.
When the view is changed, the display in the Graph section also changes to the selected time frame.
E.g. the screenshot below shows the Financial Indicators Report in Quarterly view. The second screenshot shows the same indicator in Annual view. Please note the changes to the Graph section.
Financial Indicators Report: Quarterly View

Financial Indicators report: Annual view

Clicking on an individual month, quarter or year link takes you to the Financial Indicators Detail which lists all the transactions for the selected month, quarter, or year.
Financial Indicators report: Financial Indicators Detail
The Financial Indicators Detail page shows a list of all the transactions for the selected time period. The header of the Drilldown Data grid displays a bread crumb trail which shows the dashboard name (if you arrived at this page from the Dashboard page), the indicator name and selected time period.
The details in this view include:
- Summary Row at the top of the grid specifying: Numerator, Denominator, Formula, and Rate
- Post To Date - the date on which transactions are posted,
- Transaction Description,
- Account Number,
- Credit Amount, and
- Debit Amount.

On this grid, filtering can be performed only on the following fields: Transaction Description and Account Number.
This grid also provides the option to add fields from the Field List and Export Drilldown Data.
As on many RAPID grids, you can group the data on the Financial Indicators Detail grid if you are searching for specific accounts or transactions. Subtotals are displayed on grouping. The list is paginated and comes with the paging controls for First, Prev, Next, Last, and All options. You can also display additional records.
To close the Financial Indicators Detail page and view the Financial Indicators Report again, click on the Collapse icon on the top right of the grid.
Financial Indicators Report: Charts
Charts: Trend Tab
The Trend tab in the Charts section displays the following details:
- Goals,
- Rate,
- Benchmarks
- Trendline
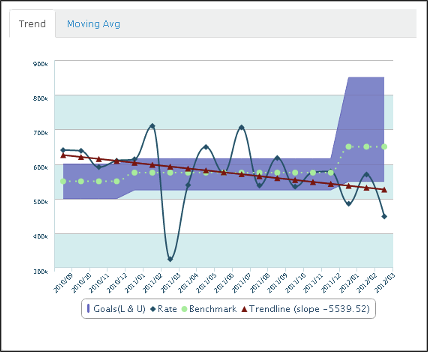
The graph displayed is dependent on the time frame selected in the Results section. E.g. If the Results section is set to Monthly view, then the Trend tab also displays the Monthly graph. If the Results section is changed to Quarterly view, the Trend tab changes to the Quarterly graph as well.
If you hover over any individual data point marked on the Moving Avg graph, you will see details such as Date, Goals or Trendline displayed in a popup.
If you click on a legend label such as Rate, Benchmark, and Trendline, it is grayed out, and the corresponding display removed from the graph. To see the line in the display again, click on the grayed label name again.
Charts: Moving Avg Tab
The Moving Avg tab displays the following details:
- Denominator, bar charts representing the denominator for the indicator,
- Moving Avg(D), or the moving average for the denominator,
- Numerator*, bar charts representing the numerator for the indicator,
- Moving Avg(N)*, or the moving average for the numerator.
*- displayed only if the indicator rate calculations involve a numerator.

The graph displayed is dependent on the data in the Results section. E.g. If the Results section is set to Monthly view, then the Moving Average tab also displays the Monthly graph. If the Results section is changed to Quarterly view, the Moving Average tab changes to the Quarterly graph as well.
If you hover over any individual data point marked on the Trend graph, you will see additional details such as Date, Moving Average (N) or Moving Average (D) displayed in numbers.
Financial Dashboard: Billing and Receivable (BAR) Dashboard
A standard BAR Dashboard page consists of the following sections:
- Indicator Grid consisting of indicator data for the last six months,
- Pie Charts, visual representation of the same data in the the indicator grid,
- Calendar Grid, containing daily totals for the month,
- Bar Graph showing the average by day of the week for the selected month and department

Hovering over Indicator Name displays the description associated with the indicator in a tooltip. Hovering over the Trend icon for an indicator displays additional details, such as how the indicator trended, whether an upward or downward trend is considered better for the indicator, and what the slope is. If you hover over the indicator data for any time period, the Indicator Analysis tooltip is shown.
Hovering over a Pie Slice or Bar Graph for an indicator displays additional details, such as name of Month or Day of the Week and indicator rate.
In the Pie Chart, months with negative values are displayed in the chart while months with no data are excluded from it. You can also deselect a month by clicking on the month name below the pie chart. This redisplays the pie chart with the month's data hidden.
Clicking on a Pie Slice changes the display in the Calendar, and Bar Graph grids to display the data for the selected indicator and month. The selected month in the pie chart is also highlighted in the Indicator grid.
Financial Dashboard: Selecting a Pie Slice
