A standard GL Dashboard page includes the following details:
- Indicator Name,
- Trend - which displays how the indicator has been trending till date,
- The indicator value by month for the last six (6) months,
- Pie chart for each indicator
- Daily values for an indicator for a selected month
- Average by Day of Week for a selected indicator and month

BAR Dashboard: Gear Menu

Monthly Financial Activity Gear Menu: Change Dashboard
If you would like to view a different dashboard, you can do so by changing the dashboard. Click on the Change Dashboard link to bring up a grid of available dashboards. Select a dashboard from the grid. This action displays the dashboard you selected. Any filtering applied on the previous dashboard is removed.
Monthly Financial Activity Gear Menu: Set as Default/Reset to Default
To set the dashboard you are viewing as your default dashboard, click on the Set as Default. This dashboard will be displayed by default the next time you open the Dashboard page. The Set as Default option in the gear menu is changed to Reset to Default.
If you would like to revert to having no dashboard as default, you can click on Reset to Default option. This removes the default dashboard for your login id. The next time you open the Dashboard page, the dashboard you use most frequently will be displayed. When you select this option, the Reset to Default option toggles back to Reset to Default.
Monthly Financial Activity Gear Menu: Corporation/Department Filter
Dashboard data can be filtered by corporation or department. Click on the Corporation/Department Filter to view the list of available corporations and departments. Only those corporations and departments you have access to will be listed. Select the corporations and the departments to filter by and click Ok.
The dashboard display changes to data for the selected departments only. Additionally, a Filter icon is displayed next to the dashboard name on the Dashboard page to indicate that the dashboard data is filtered.
To remove filtering, click Clear Filters from the gear menu.
Monthly Financial Activity Gear Menu: Change BAR Dashboard Period
By default, any BAR dashboard shows data for the current month and going back five additional months. If you would like to view the results of a different time period, you can do so by changing the dashboard period. Click on the Change BAR Dashboard Period link to view the calendar control and choose months. Select a month from the control and click OK. The dashboard is redisplayed with data from the selected month and going back five months.
Monthly Financial Activity Gear Menu: Show Data by Batch Date/Show Data by Service date.
By default, the BAR dashboard shows indicator data by Service Date. You can also toggle the dashboard view to see data by Batch date. To do so, click on the Show Data by Batch Date option. The dashboard is redisplayed to show data by batch date instead of service date, and in the Gear menu, the Show Data by Batch Date option is replaced with Show Data by Service Date option.
Monthly Financial Activity Gear Menu: Show Dashboard Data
The BAR dashboard shows indicator charge data by default. You can change the dashboard view to see data by Derived Cost, RVU or Count. To do so, click on the Show Dashboard Data option. This action displays the Select Option popup. Select the appropriate radio option and then close the popup. The dashboard is redisplayed to show the data and scores for the option you selected. The breadcrumb trail displays the option you selected next to the dashboard name.
BAR Dashboard: Select Option

BAR Dashboard: Change in Breadcrumb trail

Monthly Financial activity Gear Menu: Clear Filters
Click the Clear Filters option to remove any filters.
The dashboard display changes to show data for all departments and corporations you have access to. The Filter icon next to the dashboard name in the header is hidden as well.
Monthly Financial Activity Gear Menu: Export to PDF/Excel
You can export the displayed dashboard data to PDF or Excel. You also can email the dashboard data as a PDF or Excel attachment.
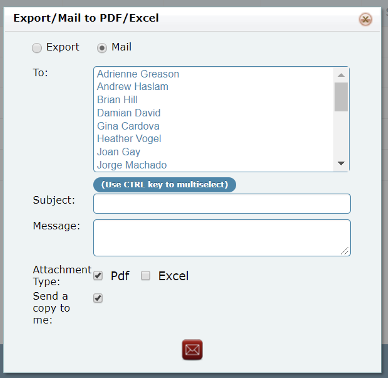
Click the Export to PDF/Excel option. RAPID displays the Export/Mail to PDF/Excel pop-up. Choose what you would like to do by selecting the Export or Mail radio button.
The Export option allow you to enter notes. You can click on the PDF or Excel icon to export the file to the specific format.
The Mail option allows you to select one or more users to send the report to. You can specify a Subject, Message, and select the file format (PDF/Excel) for the dashboard data to be emailed. You can also check the Send a copy to me to have a copy of the email cc'd to you.
Note: Please note that only a subset of the data displayed on screen is exported. Currently RAPID exports pie charts and grid data.
BAR Dashboard: BAR Report Page
Clicking on a month, quarter or annual total in the Indicator Grid displays the BAR Report page.
BAR Report Page popup displays the transactions that were serviced for the selected time period.
BAR Report Page: Gear Menu
If you hover over the Gear icon on the top right corner of the BAR Dashboard grid, you will see additional options displayed as a dropdown menu.
BAR Report Page Gear Menu: Field List
You can customize the report by adding fields from the Field List.
BAR Report Page Gear Menu: Meta Data
To view indicator metadata, click on the Meta Data option. This action displays a Meta Data popup where you can see the metadata associated with it.
BAR Report Page Gear Menu: Annotations
To enter annotations for the dashboard, click on the Annotations option. This action displays the Annotations popup. The steps required to add/edit/delete annotations are the same as discussed above in the GL Dashboard Annotations section.
BAR Report Page Gear Menu: Export/Mail to PDF/Excel
You can also export the displayed dashboard data to PDF or Excel or email the report to yourself and other users.
In the popup displayed, click either the Export or Mail option.
If Export is selected, you can choose the format to export the data by clicking on the appropriate button. If you want to export to PDF, you also have the option of exporting any associated metadata.

If Mail is selected, RAPID displays additional options. You can select one or more recipients, specify subject and message, the format to email report attachments in, and choose whether you want a copy sent to yourself.
BAR Report Page Gear Menu: Mail
BAR Dashboard: BAR Dashboard Drilldown Data
Clicking on an indicator name or a day's totals in the Calendar Grid displays the Drilldown Data popup.
The Drilldown Data popup displays the transactions that form the numerator/denominator for the indicator, or those that were serviced on that day, depending on which area of the BAR Dashboard you clicked.
The display on this page includes:
- Service/Batch DateTime - depending on what view the dashboard was on,
- VisitID,
- Account Number,
- Corporation ID,
- Department ID
- Bar Procedure ID,
- Charge Category ID, and
- Charge,
- Numerator*, and
- Denominator*.
* - may or may not be displayed depending on formula used.
As on other RAPID grids, the Drilldown Data grid can be grouped and sorted by any column. Subtotals are displayed on grouping. Filters are available on Transaction Count and Denominator columns.
Additional options are available under the Gear Menu.
The Drilldown Data grid also comes with several navigation features such as page number links,
First, Prev, Next, Last, and All buttons. You have the ability to go to a specified page number.
You can also choose how many records are displayed per page using the Records per Page drop- down.
BAR Dashboard Drilldown Data
Clicking on an indicator name or a day's totals in the Calendar Grid displays the Drilldown Data popup.
The Drilldown Data popup displays the transactions that form the numerator/denominator for the indicator, or those that were serviced on that day, depending on which area of the BAR Dashboard you clicked.
The display on this page includes:
- Service/Batch DateTime - depending on what view the dashboard was on,
- VisitID,
- Account Number,
- Corporation ID,
- Department ID,
- Bar Procedure ID,
- Charge Category ID, and
- Charge,
- Numerator*, and
- Denominator*.
*- may or may not be displayed depending on formula used
As on other RAPID grids, the Drilldown Data grid can be grouped and sorted by any column. Subtotals are displayed on grouping. Filters are available on Transaction Count and Denominator columns.
Additional options are available under the Gear Menu.
The Drilldown Data grid also comes with several navigation features such as page number links,
First, Prev, Next, Last, and All buttons. You have the ability to go to a specified page number.
You can also choose how many records are displayed per page using the Records per Page drop- down.
