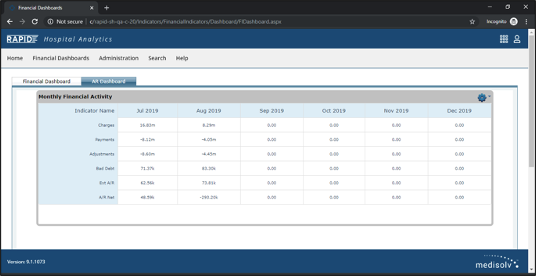
The AR Dashboard displays financial data for the last 6 months. The month view is the default view. For the current month, data is displayed up to the previous day.
The Monthly Financial Activity displays the following indicators in both tabular and bar chart format:
Charges, Payments, Adjustments, Bad Debt, Ext. A/R, A/R Net.
Monthly Financial Activity: Gear Menu
Hovering over the Gear icon in the AR Dashboard grid displays additional options.

Monthly Financial Activity Gear Menu: Change Dashboard
If you would like to view a different daily financial dashboard, you can do so by changing the dashboard. Click on the Change Dashboard link to bring up a grid of available dashboards. Select a dashboard from the grid. This action results in display of the dashboard you selected.
Monthly Financial Activity Gear Menu: Daily View/Monthly View*
On the AR Dashboard, you can toggle between daily and monthly views of financial data. The Monthly View is the default view.
To view the financial data up to the last seven days, click on the Daily View link. This action opens the Monthly View Daily View, displaying data for the last 7 days, going back from today's date.
To switch back to monthly view, click on the Monthly View link. This action opens the Monthly View, displaying data for last 6 months.
Note: *Please note that the option to toggle between daily and monthly views is available only in the AR Dashboard, and not in the other daily financial dashboards.
Monthly Financial Activity Gear Menu: Go to DFI Report
To view the daily financial data in report format, click on the Go to DFI Report. This action opens the Daily Financial View report. You can also view this report by going to the Billing and Receivables reports in the Home page of the RAPID application.
DFI Report
The DFI Report displays data for all DFI indicators.
The display on this page includes the following grids:
- Projected Monthly Summary - this grid displays the projection for the month for each of the 6 indicators. The projections are based on data collected for the month up to the previous day,
- Daily Financial Activity - this grid displays data for last 7 days up to the previous day,
- AR Dashboard - this grid displays data for last 6 months for the current month up to the previous day,
- A/R Aging Summary by Financial Class - this grid displays A/R Aging data. The data is ordered by Financial Class and A/R Age Date,
- A/R Watch List - DFNB - this grid displays the A/R Watch List consisting of patients who were Discharged but Not Final Billed (DFNB),
- Average Daily Census by Location - this grid displays the hospital's average census by location,
- Volume Indicators - this final grid displays volume indicators, such as admissions, dis- charges, Items are totals unless the item description specifically pertains to averages.
Grid data can be sorted on any column. Pagination is automatically available when the grid displays more than 10 records.

Clicking on an indicator name in the AR Dashboard grid displays the Monthly Summary.
AR Dashboard: Monthly Summary Report
The Monthly Summary page displays itemized entries for the selected indicator for the last six months.
The display on this page includes the following details:
- Bar Procedure - the bar procedure code,
- Bar Procedure Name,
- Charge Category - the charge category code associated with the procedure,
- Charge Category Name,
- Procedure Count - the number of procedures performed for the procedure code,
- YYYYMM - the year and month during which the procedures were performed, and
- Amount* - amount associated with the procedure.
* - actual column header will differ depending on the indicator you selected to arrive at this report.
Monthly Summary - Charges

As on other RAPID grids, the Monthly Summary grid can be grouped and sorted by any column. Subtotals are displayed on grouping.
The Monthly Summary grid also comes with several navigation features such as page number links, First, Prev, Next, Last, and All buttons. You have the ability to go to a specified page number.
You can also choose how many records are displayed per page using the Page Size dropdown.