For existing indicators, there are two primary ways you can set goals and benchmarks. The second method is to set performance data for several indicators at the same time, through a data import.
The Import Data functionality allows you to upload performance data in bulk for several indicators at a time.
To import performance data in bulk, first click on Import from the Data page.

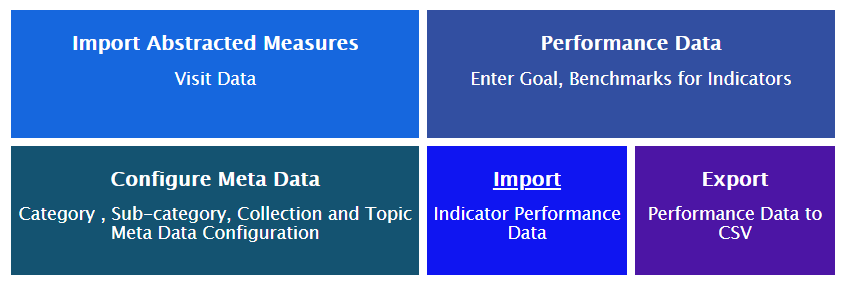
This action displays the Import Performance Data page, where you can import performance data, preview the import file, or view help about the import process.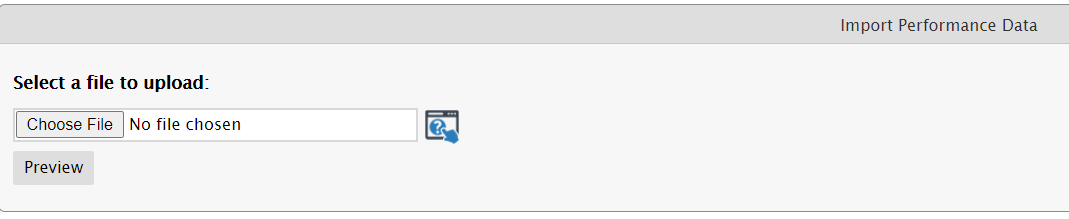
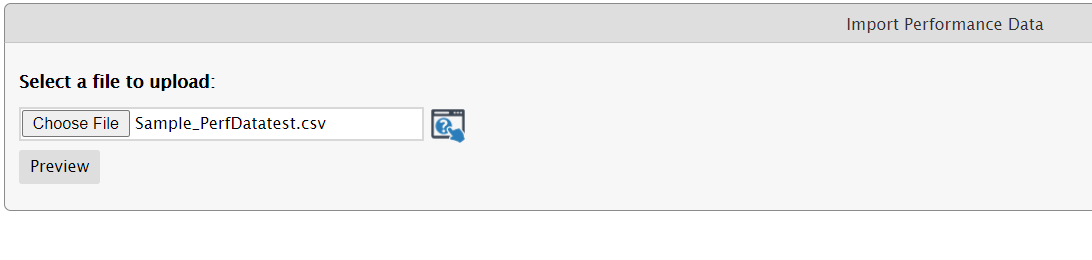
Click on the Choose File button and select a file for import. Please note that the import file should be a non-empty, flat file in .CSV format.
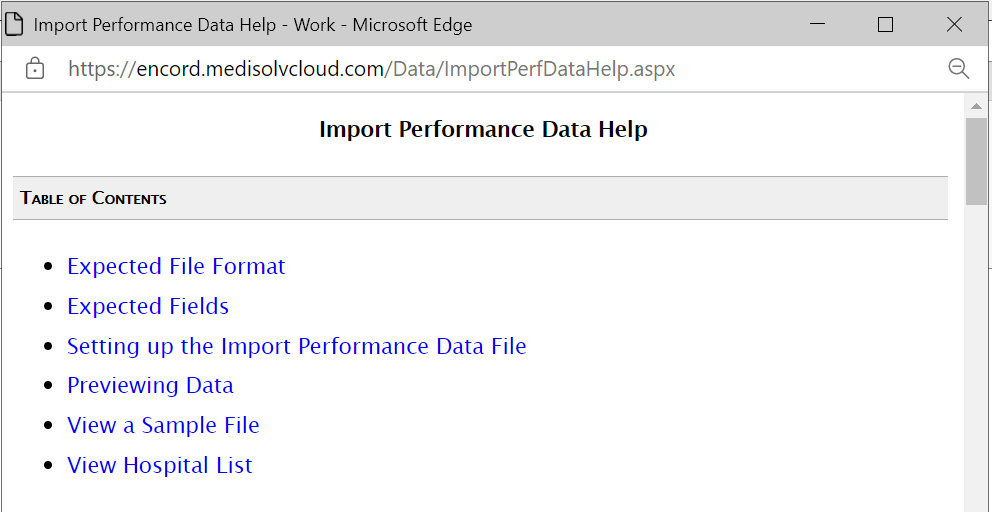
You can also download a sample file provided by Medisolv by clicking the Help (?) icon. This displays the associated Help file, and contains a link to a sample .CSV file for download. You can save the file to your machine, and use it to model your data.
The .CSV file should contain the following entries:
• Indicator Key* - the Medisolv created Indicator ID that uniquely identifies an indicator
• Indicator Name - the unique name that identifies an indicator
• Start Year/Month* - the start year and month for the performance record in YYYYMM format
• End Year/Month* - the end year and month for the performance record in YYYYMM format
• Goal Lower - goal or lower goal (for indicators with a goal range) for the indicator
• Goal Upper - the upper goal for the indicator. This value needs to be provided only for range indicators, where the acceptable goals are specified in terms of a range. If the value is entered for a non-range indicator, it is ignored
• Benchmark 1 - this value comes from published county, state, national benchmarks, used for comparison purposes only. Does not affect indicator calculation. Displayed in the report and the chart.
• Benchmark 2
• Benchmark 3
• Benchmark 4
• Benchmark 5
• Yellow Zone - A fixed value or percentage figure used to show how close the indicator values are to their goal or close to the Lower and Upper goals if Goal Range is being used. On the dashboard, indicator color codes (Green circle / Yellow triangle / Red octagon) are partially based on this value. You can specify a percentage number between 0-100 or a fixed value or leave it blank
• Is Yellow Zone Fixed? - Specify True or False or leave blank. True indicates that Yellow Zone is a fixed number. False indicates that Yellow Zone is a percentage. Blank indicates that Yellow Zone calculations are not being used. The value is not case-sensitive
• Exc. Perf. - A fixed value or percentage figure used to measure if the indicator has exceptional performance. On the dashboard, exceptional indicator performance, denoted by a Gold Star, is based on this value. This value is used only when a single goal is specified for an indicator. This value is not used if the indicator is defined as using a goal range. Specify a percentage number between 0-100 or a fixed value or leave blank
• Is Exc. Perf. fixed?, set to True if you wish the number you entered for the Exc. Perf. to be treated as a fixed number. Set to False if the Exc. Perf. value is to be calculated value as a percentage of the Goal.
• Hospital ID* - Field is displayed in sample file and is required to be entered only if ENCOR-D is a multi-hospital install and if the indicator is a hospital indicator.
* Required. One of the following is required - Goal Lower, Goal Upper or Benchmark.
Once you've selected a .CSV file, click the Preview button.

Preview validates records and displays the data contained in the .CSV.
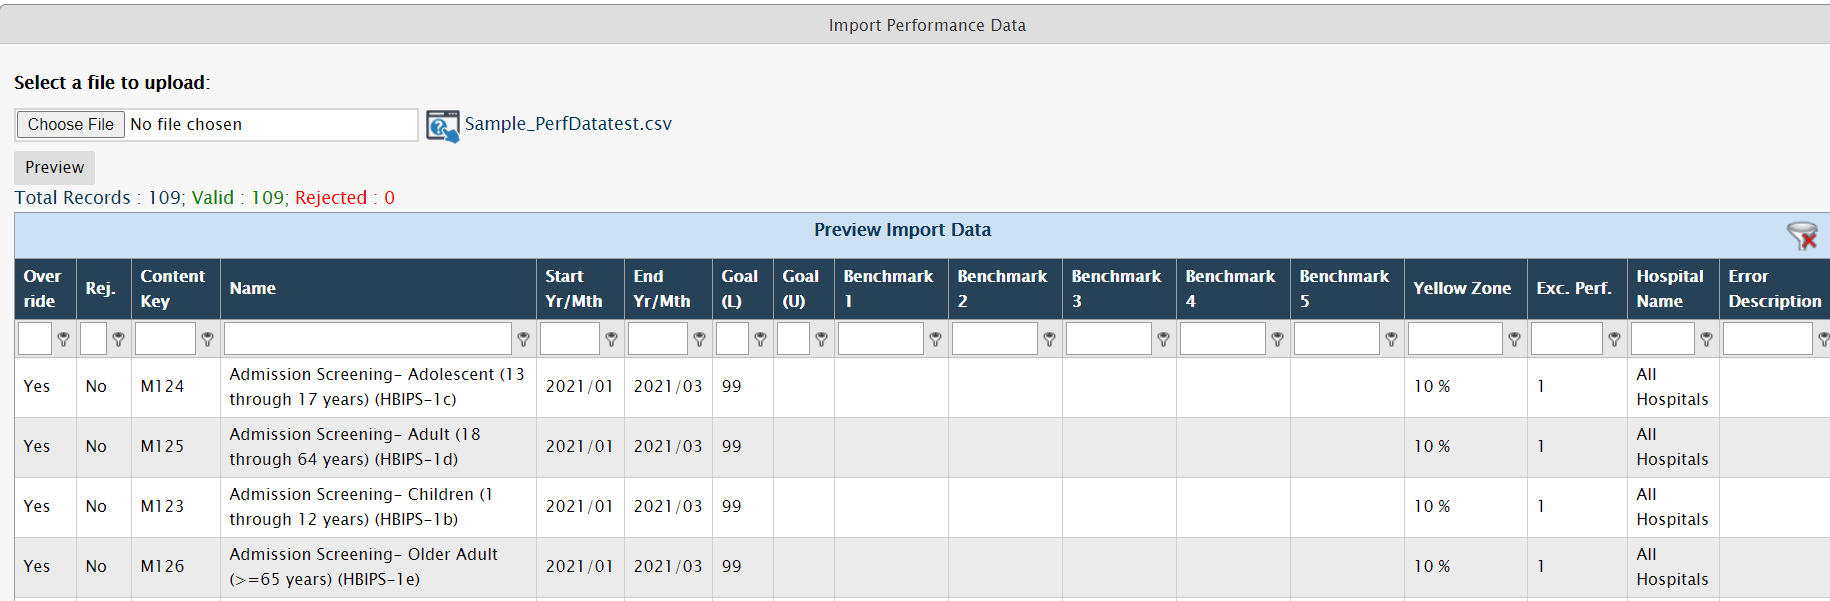
There are additional details displayed on this screen. At the very top, you see the import summary displaying record totals, the number of valid records and the number of invalid records.
Next is a listing of all records. The important columns to consider are the Override, Rej., and Error Description columns.
The Override column displays a Yes if ENCOR-D finds any overlap in dates with existing performance data records for the indicator, and No, if otherwise.
Example: The indicator already has performance data set for 202001 to 202012, and you set up your .CSV file to contain data for this same time period. When you preview the data, the Override will display a Yes for this record.
The Rej. (rejection) column displays a Yes if ENCOR-D finds any error in the performance data record, and No, if otherwise.
Example: An example of an error would be if date is entered in the wrong format, or a string is entered where a number is expected.
At this point, the data to be imported is merely displayed on screen, it has not been written into the ENCOR-D database.
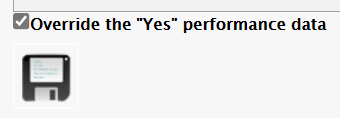
If you wish to overwrite any existing performance data with the data you are importing, check the Override the "Yes" performance data checkbox. If this is not checked, then the import will not change these records.
Example: If performance data has already been set up for 202001 to 202012, and your .CSV file contains data for a part of this time period, i.e. from 202006 to 202012. When you preview the data, the Override will display a Yes for this record. When import is performed, the months that overlapped will be replaced with the new value you imported if you select the option to Override the "Yes" performance data. In other words, 202001 to 202005 will have the original performance data, and 202006 to 202012 will be replaced with the new data you imported.
Click Save once you have imported the data to write the new goals to the database.
