For existing indicators, there are two primary ways you can set goals and benchmarks. The first method is to manually enter data for each indicator.
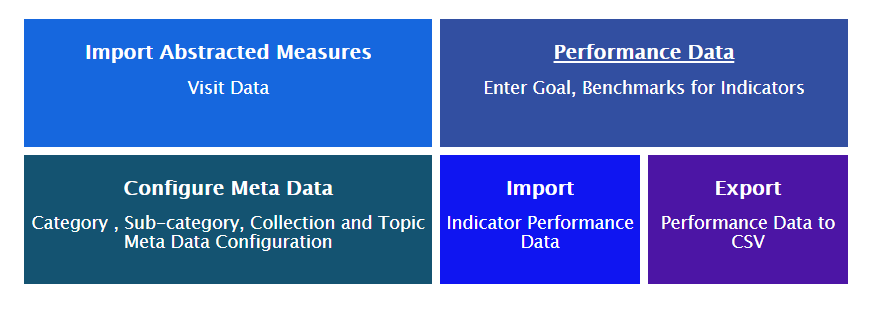
Use the Manage Data section to enter data for individual indicators. To manage individual indicators, first click on Performance Data from the Data page.
This action results in the display of the Manage Performance Data page.
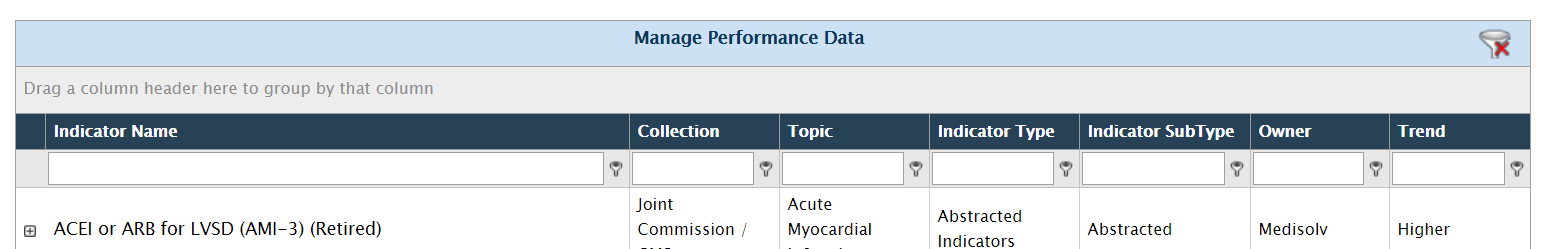
By default, the page displays a list of System Based Indicators.
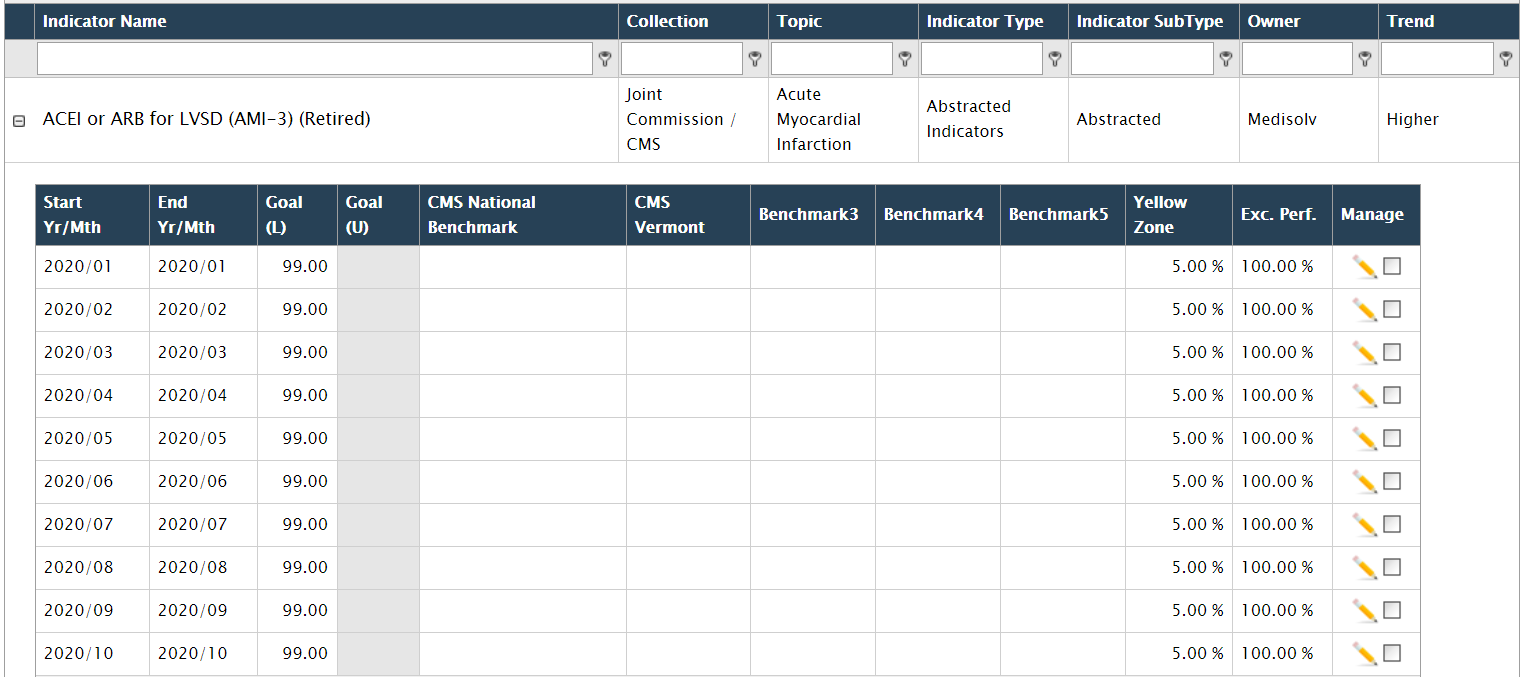
The grid displays:
• Indicator Name
• Collection - which organization's collection of indicators the indicator pertains to - CMS, Joint Commission, AHRQ, Medisolv, or Other
• Topic
• Indicator Type - whether Abstracted, Claims, Electronic, Manual, etc.
• Indicator SubType - specifies subtypes for the indicators.
• Owner - whether Medisolv created or Hospital/Facility created.
• Trend - specifies the Trend of the Indicator, if it is low or high.
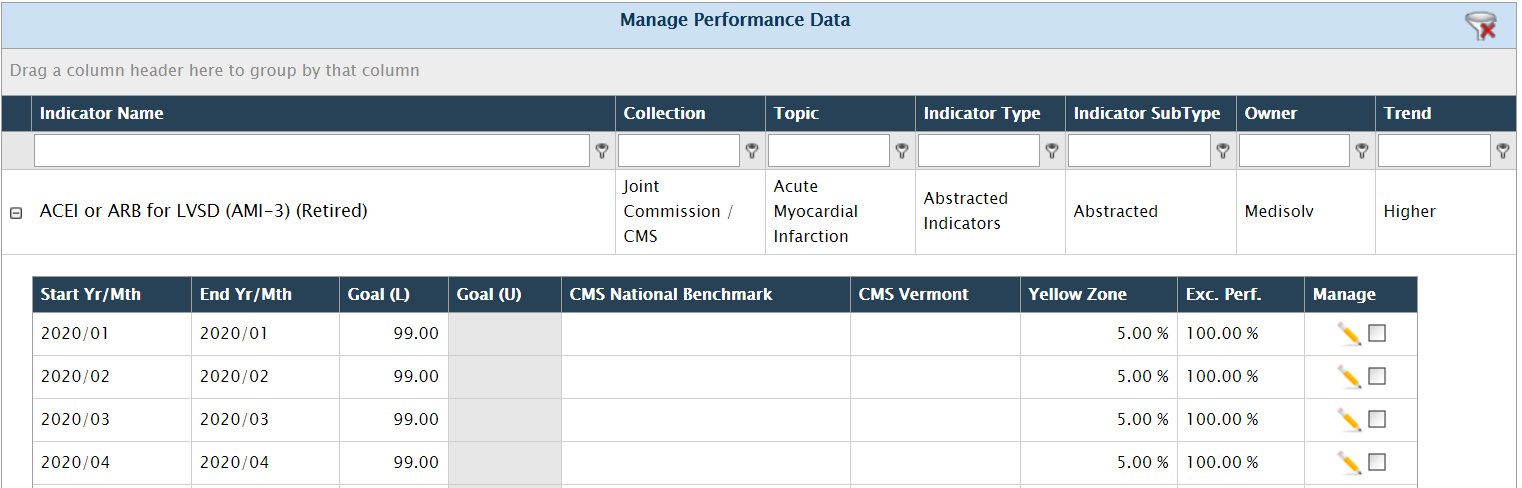
To view performance data for individual indicators, click on the + sign next to the Indicator Name.
When the Indicator node is expanded, all performance goals set for that indicator are displayed.
As on other ENCOR-D grids, you can filter the data on the Manage Performance Data grid if you are searching for specific indicator(s). The list is paginated and comes with the standard paging controls and Clear Filter option.
To create a new Performance Data record, click the New icon at the bottom right of the grid.


An empty Indicator table will be displayed.
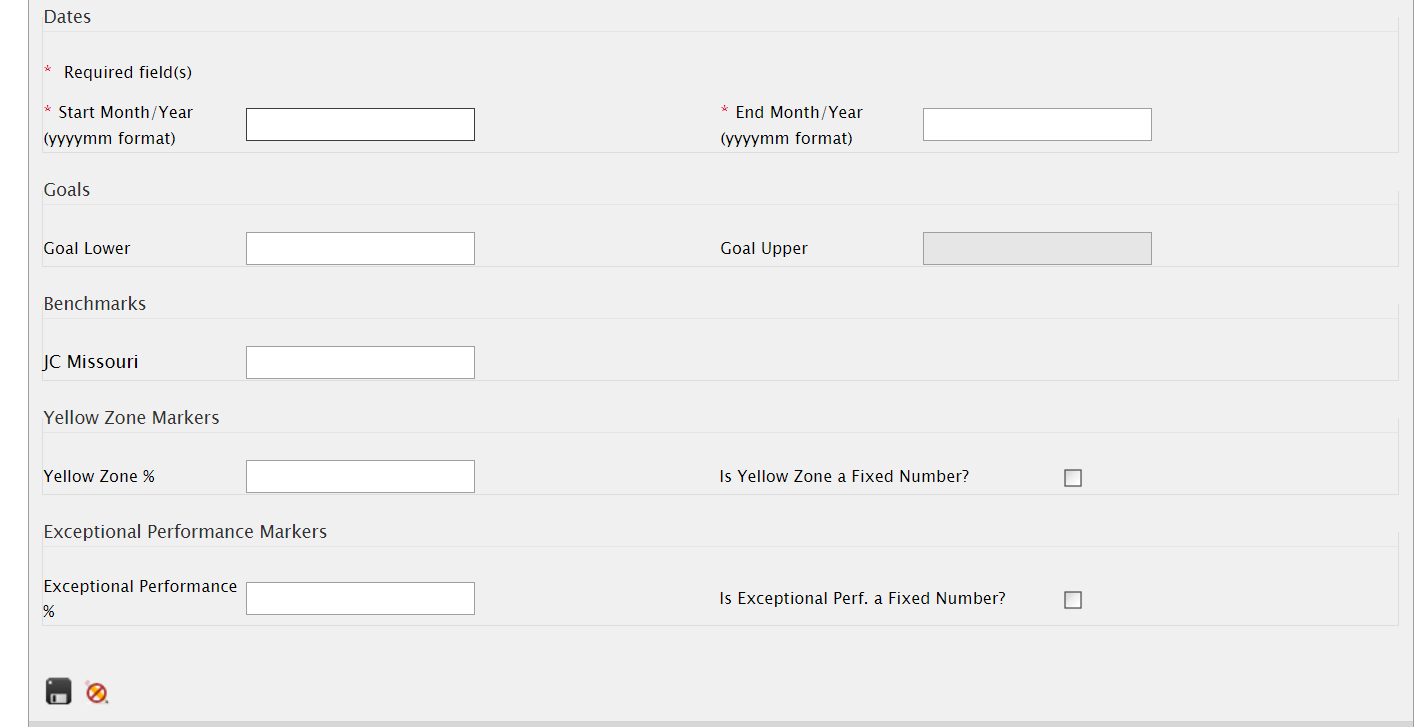
You can enter the following information for the indicator:
• Start Month/Year* - The start year and month for the performance record in YYYYMM format.
• End Month/Year* - The end year and month for the performance record in YYYYMM format.
• Goal Lower - Goal or lower goal (for indicators with a goal range) for the indicator.
• Goal Upper - The upper goal for the indicator. This value needs to be provided only for range indicators, where the acceptable goals are specified in terms of a range.
• Benchmark 1** - This value comes from published county, state, national benchmarks, used for comparison purposes only. Does not affect indicator calculation. Displayed in the report and the chart.
• Benchmark 2**
• Benchmark 3**
• Benchmark 4**
• Benchmark 5**
• Yellow Zone / Yellow Zone % - A fixed value or percentage used to display how close the indicator values are to their goal or close to the Lower and Upper goals if Goal Range is utilized.
On the dashboard, indicator color codes (Green circle / Yellow triangle / Red octagon) are partially based on this value. You can specify a percentage number between 0-100 or a fixed value or leave it blank.
• Is Yellow Zone a fixed number? - a check indicates that the number you entered for the Yellow Zone is treated as a fixed number. If this checkbox is unchecked, the Yellow Zone limit is calculated by adding it to the Lower Goal value (and Upper Goal values, if this indicator's goals are a range).
• Exceptional Performance / Exceptional Performance % - A fixed value or percentage figure used to measure if the indicator has exceptional performance. On the dashboard, exceptional indicator performance, denoted by a Gold Star, is based on this value. This value is used only when a single goal is specified for an indicator. This value is not used if the indicator is defined as using a goal range. Specify a percentage number between 0-100 or a fixed value or leave blank.
• Is Exceptional Performance a fixed number? - A check indicates that the number you entered for the Exceptional Performance is treated as a fixed number. If this checkbox is checked, the Exceptional Performance limit is calculated by adding it to the Lower Goal value.
* Required. One of the following is required - Goal Lower, Goal Upper or Benchmark.
** The benchmarks and the names displayed depend on what you set them up as in the Configure Benchmarks page in the Administration section. If two benchmarks were set up with specific names, only those two benchmarks will be displayed.
After entering the indicator information, click on :
• Save to create the indicator record, or

• Cancel to discard the details you entered.
Please note that ENCOR-D does not allow you to enter performance data for overlapping dates. If you attempt to save performance data for a time period for which data exists prior, an error message stating, "Error: Date(s) cannot fall within previously entered time frames", it also specifies dates where the overlap occurs. You will need to rectify the error before saving.
Example: In the screenshot below, the indicator has performance data for the period 2020/01 to 2020/10. If you enter data for the period 2020/01 to 2020/02 for this indicator, and click the Save icon, you will get an error.

If you enter performance figures for several months in a specific time period, an entry is added for each month in the time period.