- Help Center
- RAPID Analytics
- Cost and Profitability (Reporting)
-
ENCOR for Chart Abstracted Measures
- Medisolv Administrator Documents (Medisolv Access ONLY)
- Archived Release Notes (Medisolv Access ONLY)
- Abstracted Dashboards (Medisolv Admin Only)
- Videos
- Home
- Concurrent Abstraction
- Administration (Facility Administration)
- Medisolv Administrator (Medisolv Access ONLY)
- Reminders
- Reporting
- Navigation & Page Setup Tools
- Frequently Asked Questions/Tip Sheets
- IRR (Inter-rater Reliability)
- Abstraction
- Release Notes
- Medisolv Import File Specifications
-
ENCOR for Clinician Electronic Measures
- Regulatory Resources
- Data Validation & Improvement Reports
- Navigating the Home Page
- Submissions & Audit Management
- ENCOR Support
- Using the Administrative Functions
- General Navigation
- Using System Functions
- Mapping
- Patient Cohort Instructions (Patient Cohort)
- Improvement Activities PDSA (Plan-Do-Study Act)
- Navigating the eCQM Dashboard
- Introduction
-
RAPID Analytics
- Administration (Admin Reports and Management)
- Administration (Cost/GL Management)
- Administration (Module Management)
- Administration (Access Management)
- Administration (User Group Management)
- Revenue Cycle (Billing & Receivables)
- Administration (User Reports)
- Release Notes
- Quality and Safety (Readmissions)
- Administration (DR and Visits Report)
- Administration (Financial Indicator)
- Administration (Data Mapping)
- Views (Function)
- Financial Dashboard (General Ledger)
- Cost and Profitability (Reporting)
- Administration (DR and Visits Reports)
- Administration (View Builder Management)
- Financial Dashboard (AR)
- Cubes (Function)
- Financial Dashboard (BAR)
- Clinical Departments (Emergency)
- Cost and Profitability (Methodologies)
-
ENCOR Benchmarking
-
ENCOR Dashboard
-
OPAL
-
Technical Documentation
-
ENCOR for Hospital Electronic Measures
- Navigating the eCQM Reporting Page
- Using the System Functions
- Data Validation & Improvement Reports
- Regulatory Resources
- Navigating the Home Page
- Configuration
- ENCOR-EH Support
- Using the Administration Functions
- Navigating the Objective Measures Reporting Page
- Objective Measure Management Tools
- Release Notes
- Introduction
- Medisolv Submission Portal (MSP)
- Other Quality & Compliance Reports
- Submission & Audit Management
-
Education & Resources
-
Medisolv's HERE Conference
Cost and Profitability Reporting
Within the Revenue Cycle module in the RAPID application are four Charge vs. Cost Analysis reports covering per Bar Procedure, by Attending Provider, by Surgical Provider and by CPT Procedure. Advantages of these reports are speed, flexibility, and ease of use. Report run times are measured in seconds as opposed to hours and the user has the flexibility to quickly summarize data output by different criteria such as Charge Group and Charge Subgroup (UB Charge Category).
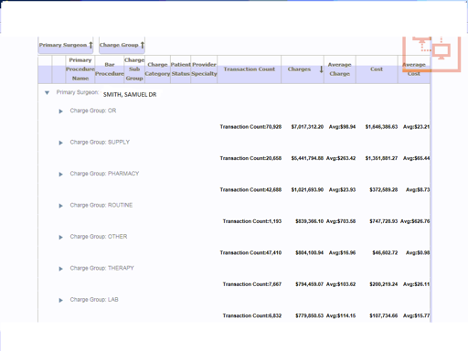
These types of reports are useful not only for Financial leaders in the organization but also for department heads keeping up with charge/cost volumes relating to services their departments provide. Two examples are included below, one for a Radiology department breakdown by modality and another for a breakdown by Surgical Providers where the output shows charges/cost per provider broken down by the different functional areas of the hospital.


Once the end user is at the BAR Procedure level of the report output, drilldown from the number of billable transactions to a list of patients that had that charge as part of their record is available, including charge reversals.
The driving reason for generating cost of BAR Procedures into the system is to be able to calculate profitability at various levels. There are three Profitability reports in RAPID for doing so. Two of those reports allow the user to drill down to patient level information regardless of Patient Status (Views). One of these two reports is target to inpatients. The user can create report output that summarizes inpatient profitability by Attending Provider and DRG. The other report can be used for any patient status, i.e. by Emergency Room Providers.